


Pipeline visibility before the forecast
Coverage reports and rep analytics show you how outbound activity becomes pipeline — while there's still time to do something about it.
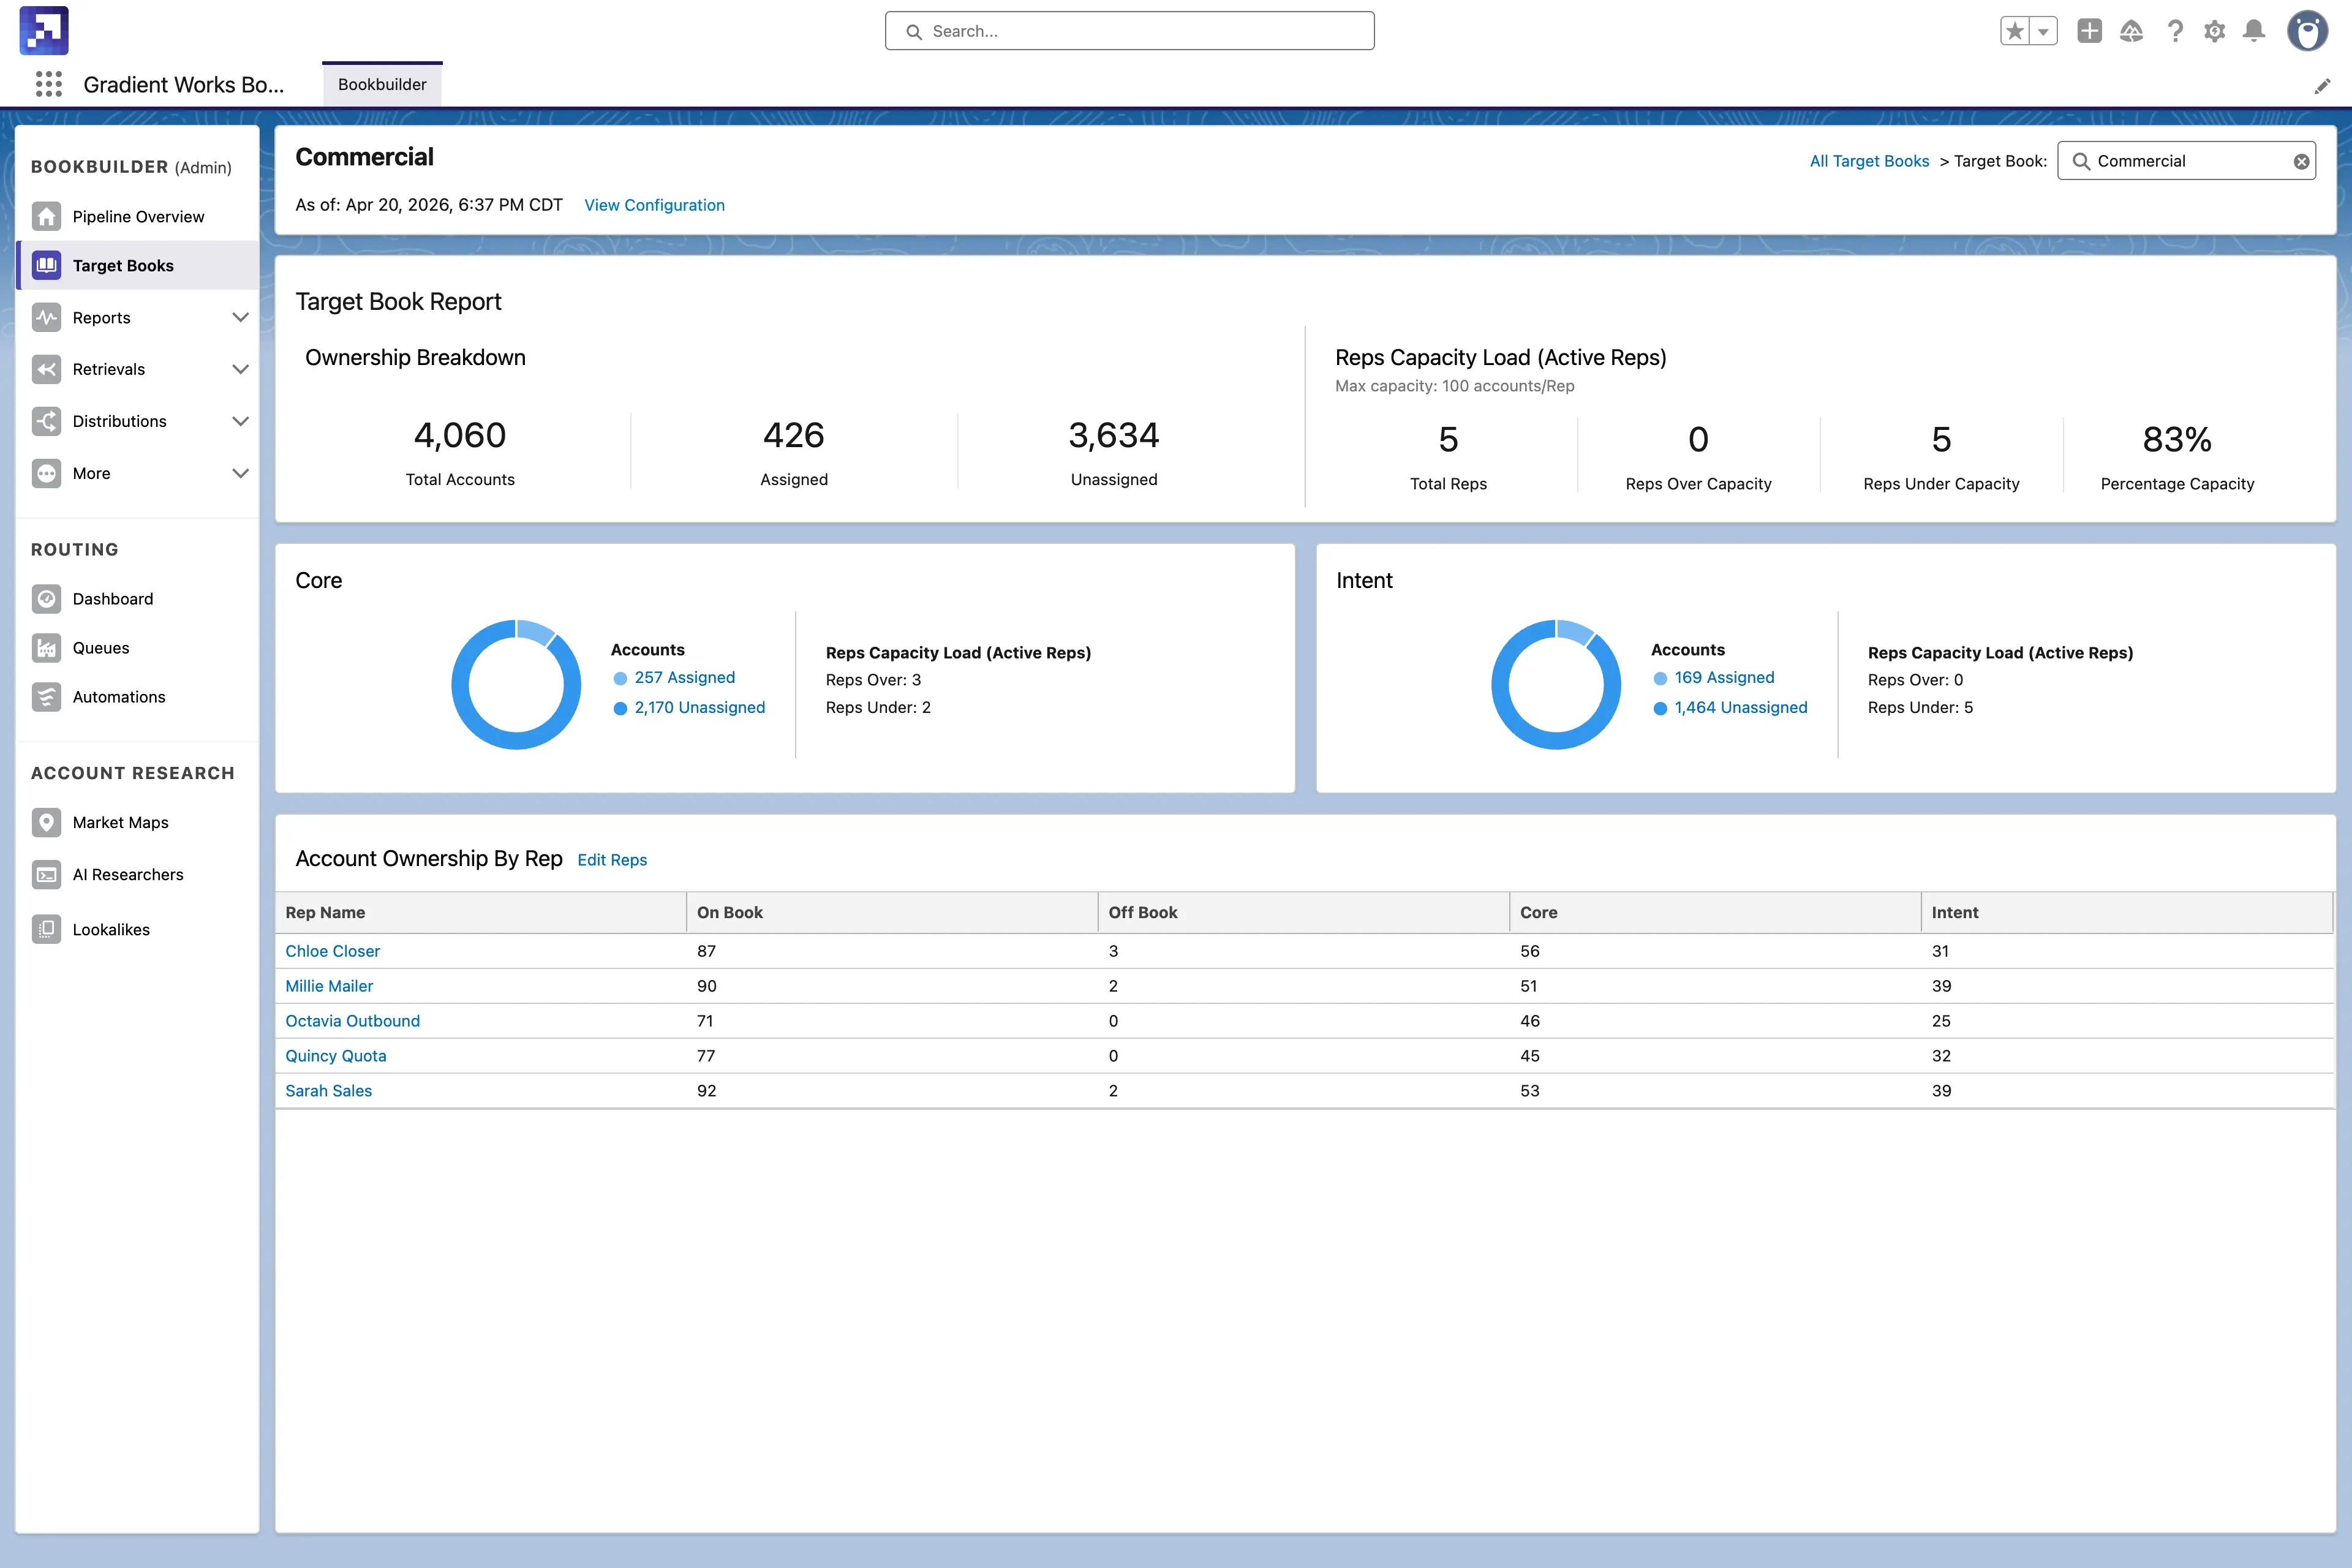
See exactly how pipeline gets created
Gradient Works Analytics is purpose-built for the top of the funnel. Track coverage gaps, rep-level engagement, and opp creation rate in one place — not buried in three different dashboards.
Coverage Reports
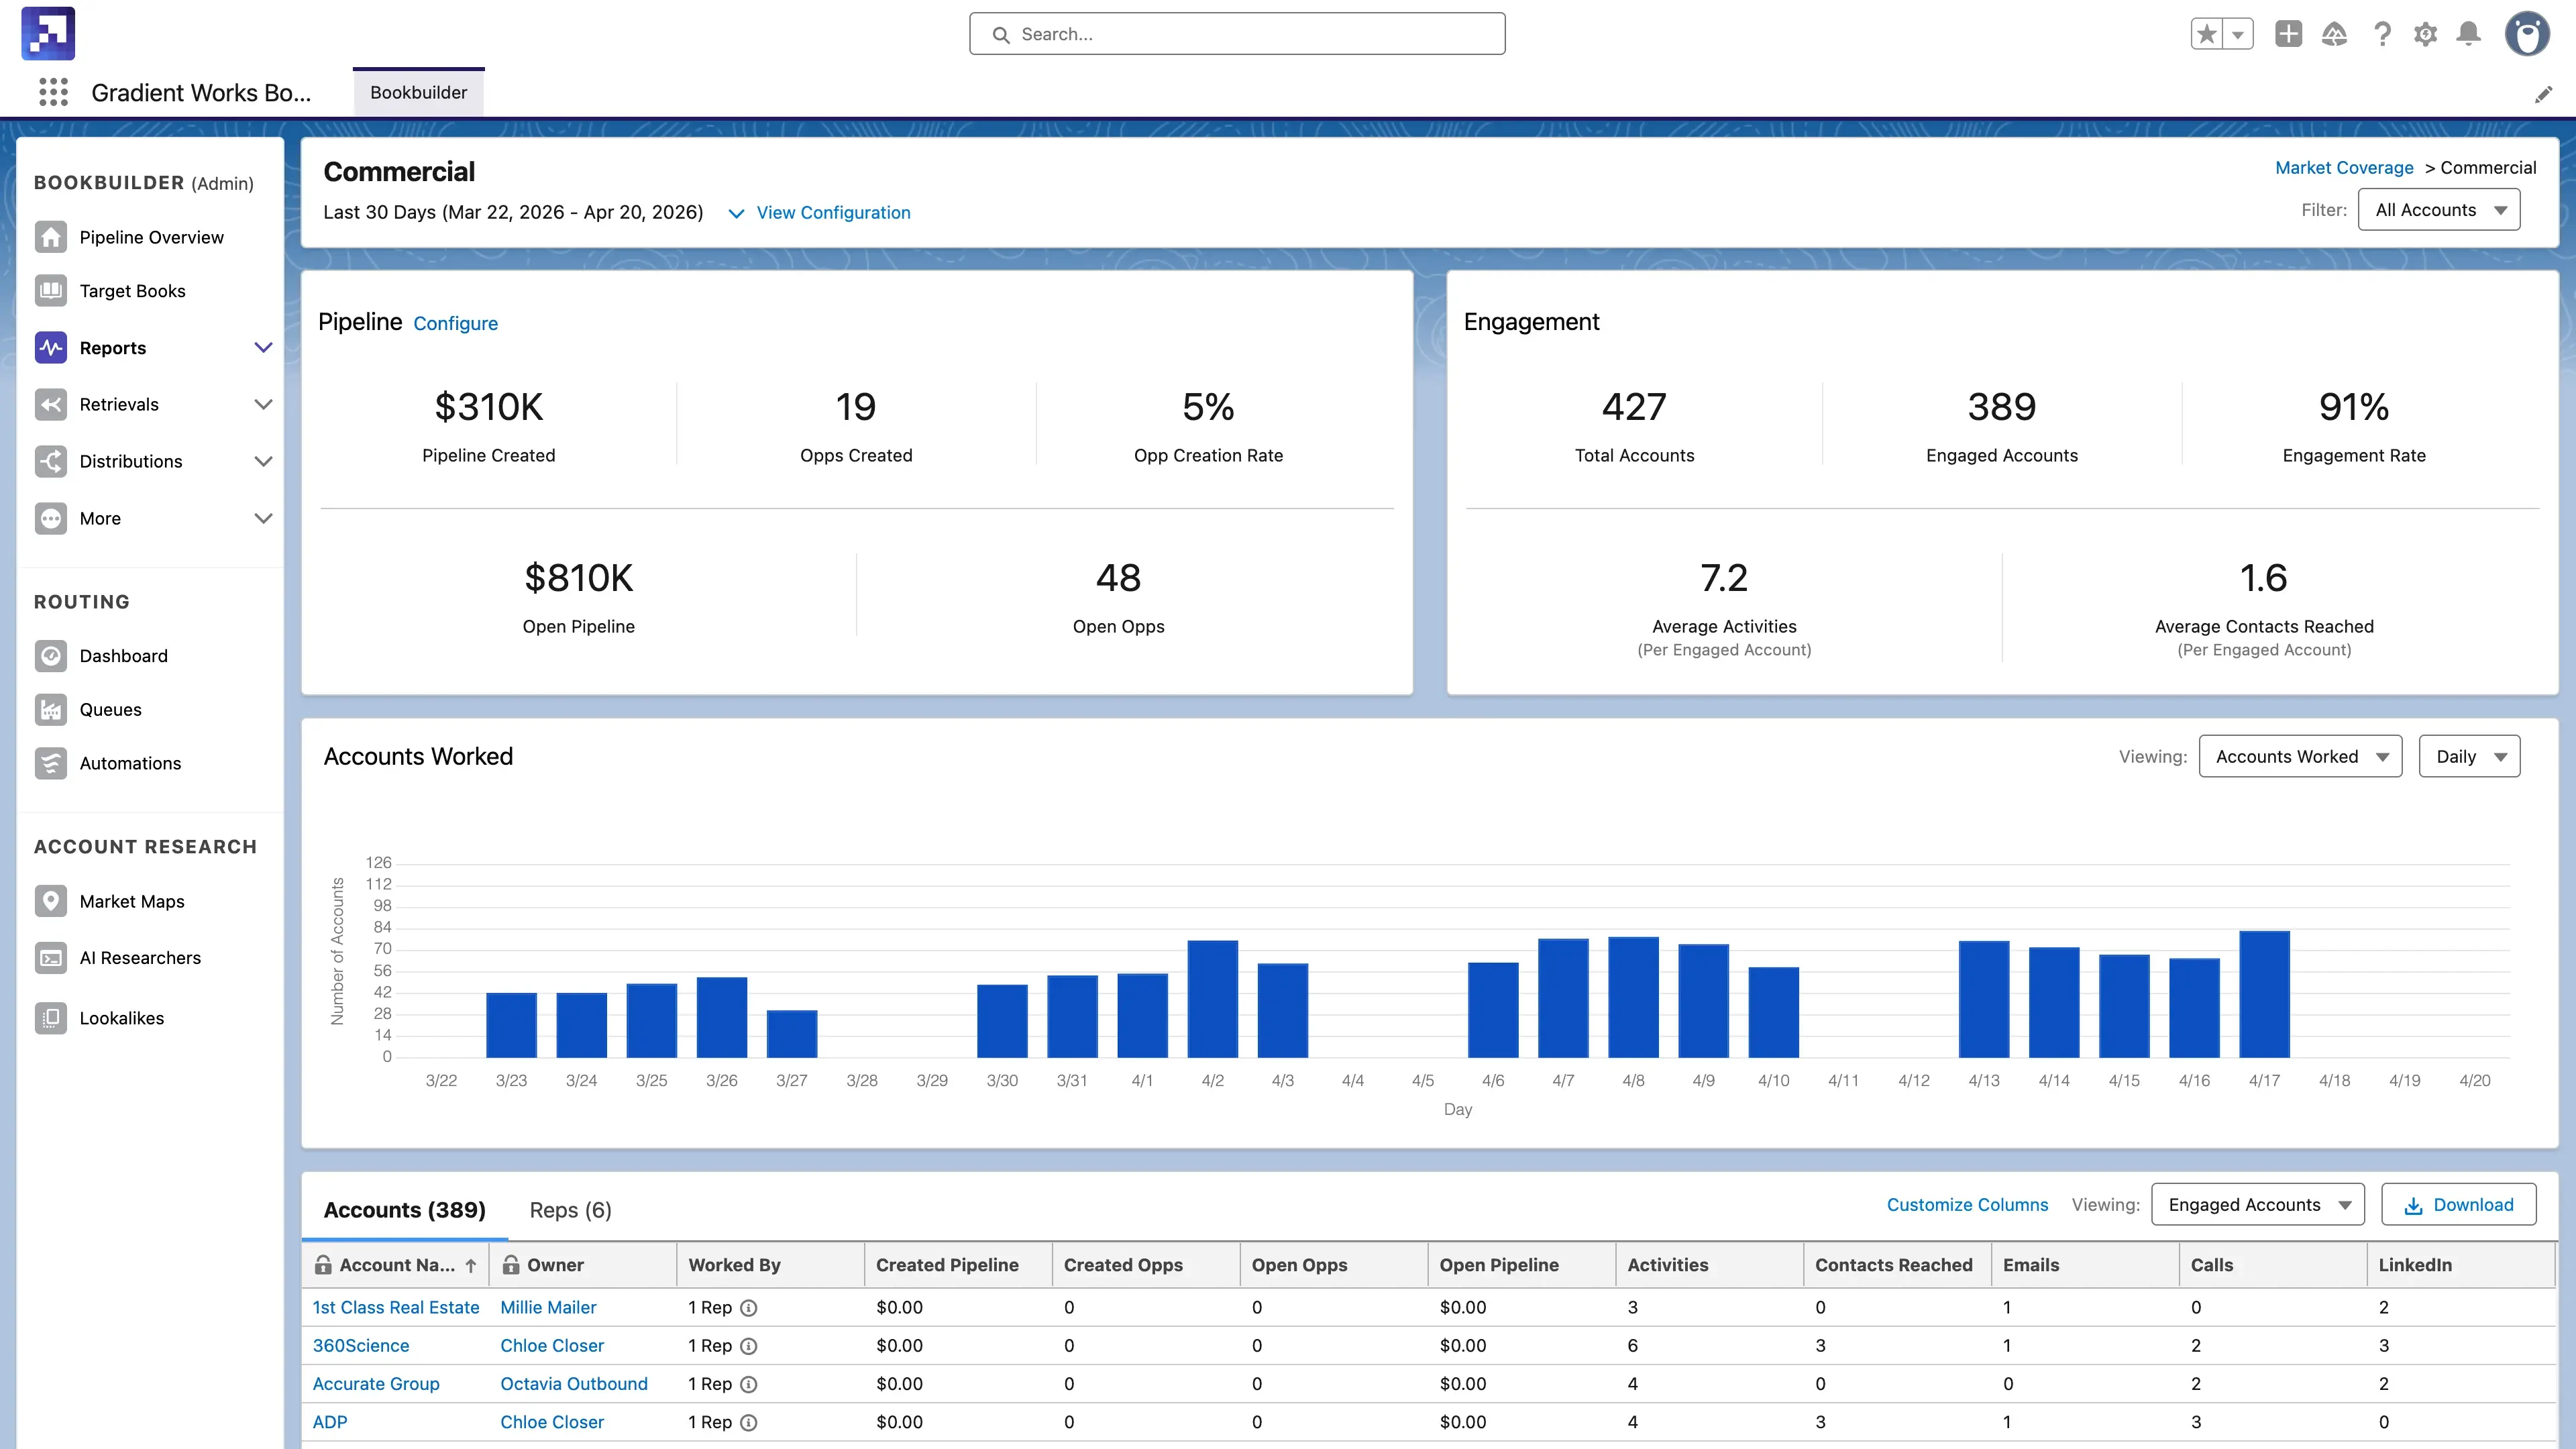
Track every account in every segment
Coverage reports measure pipeline creation and engagement across any segment you define. Tier 1 accounts, a specific vertical, or a named target list — all in one view.
Rep Reports
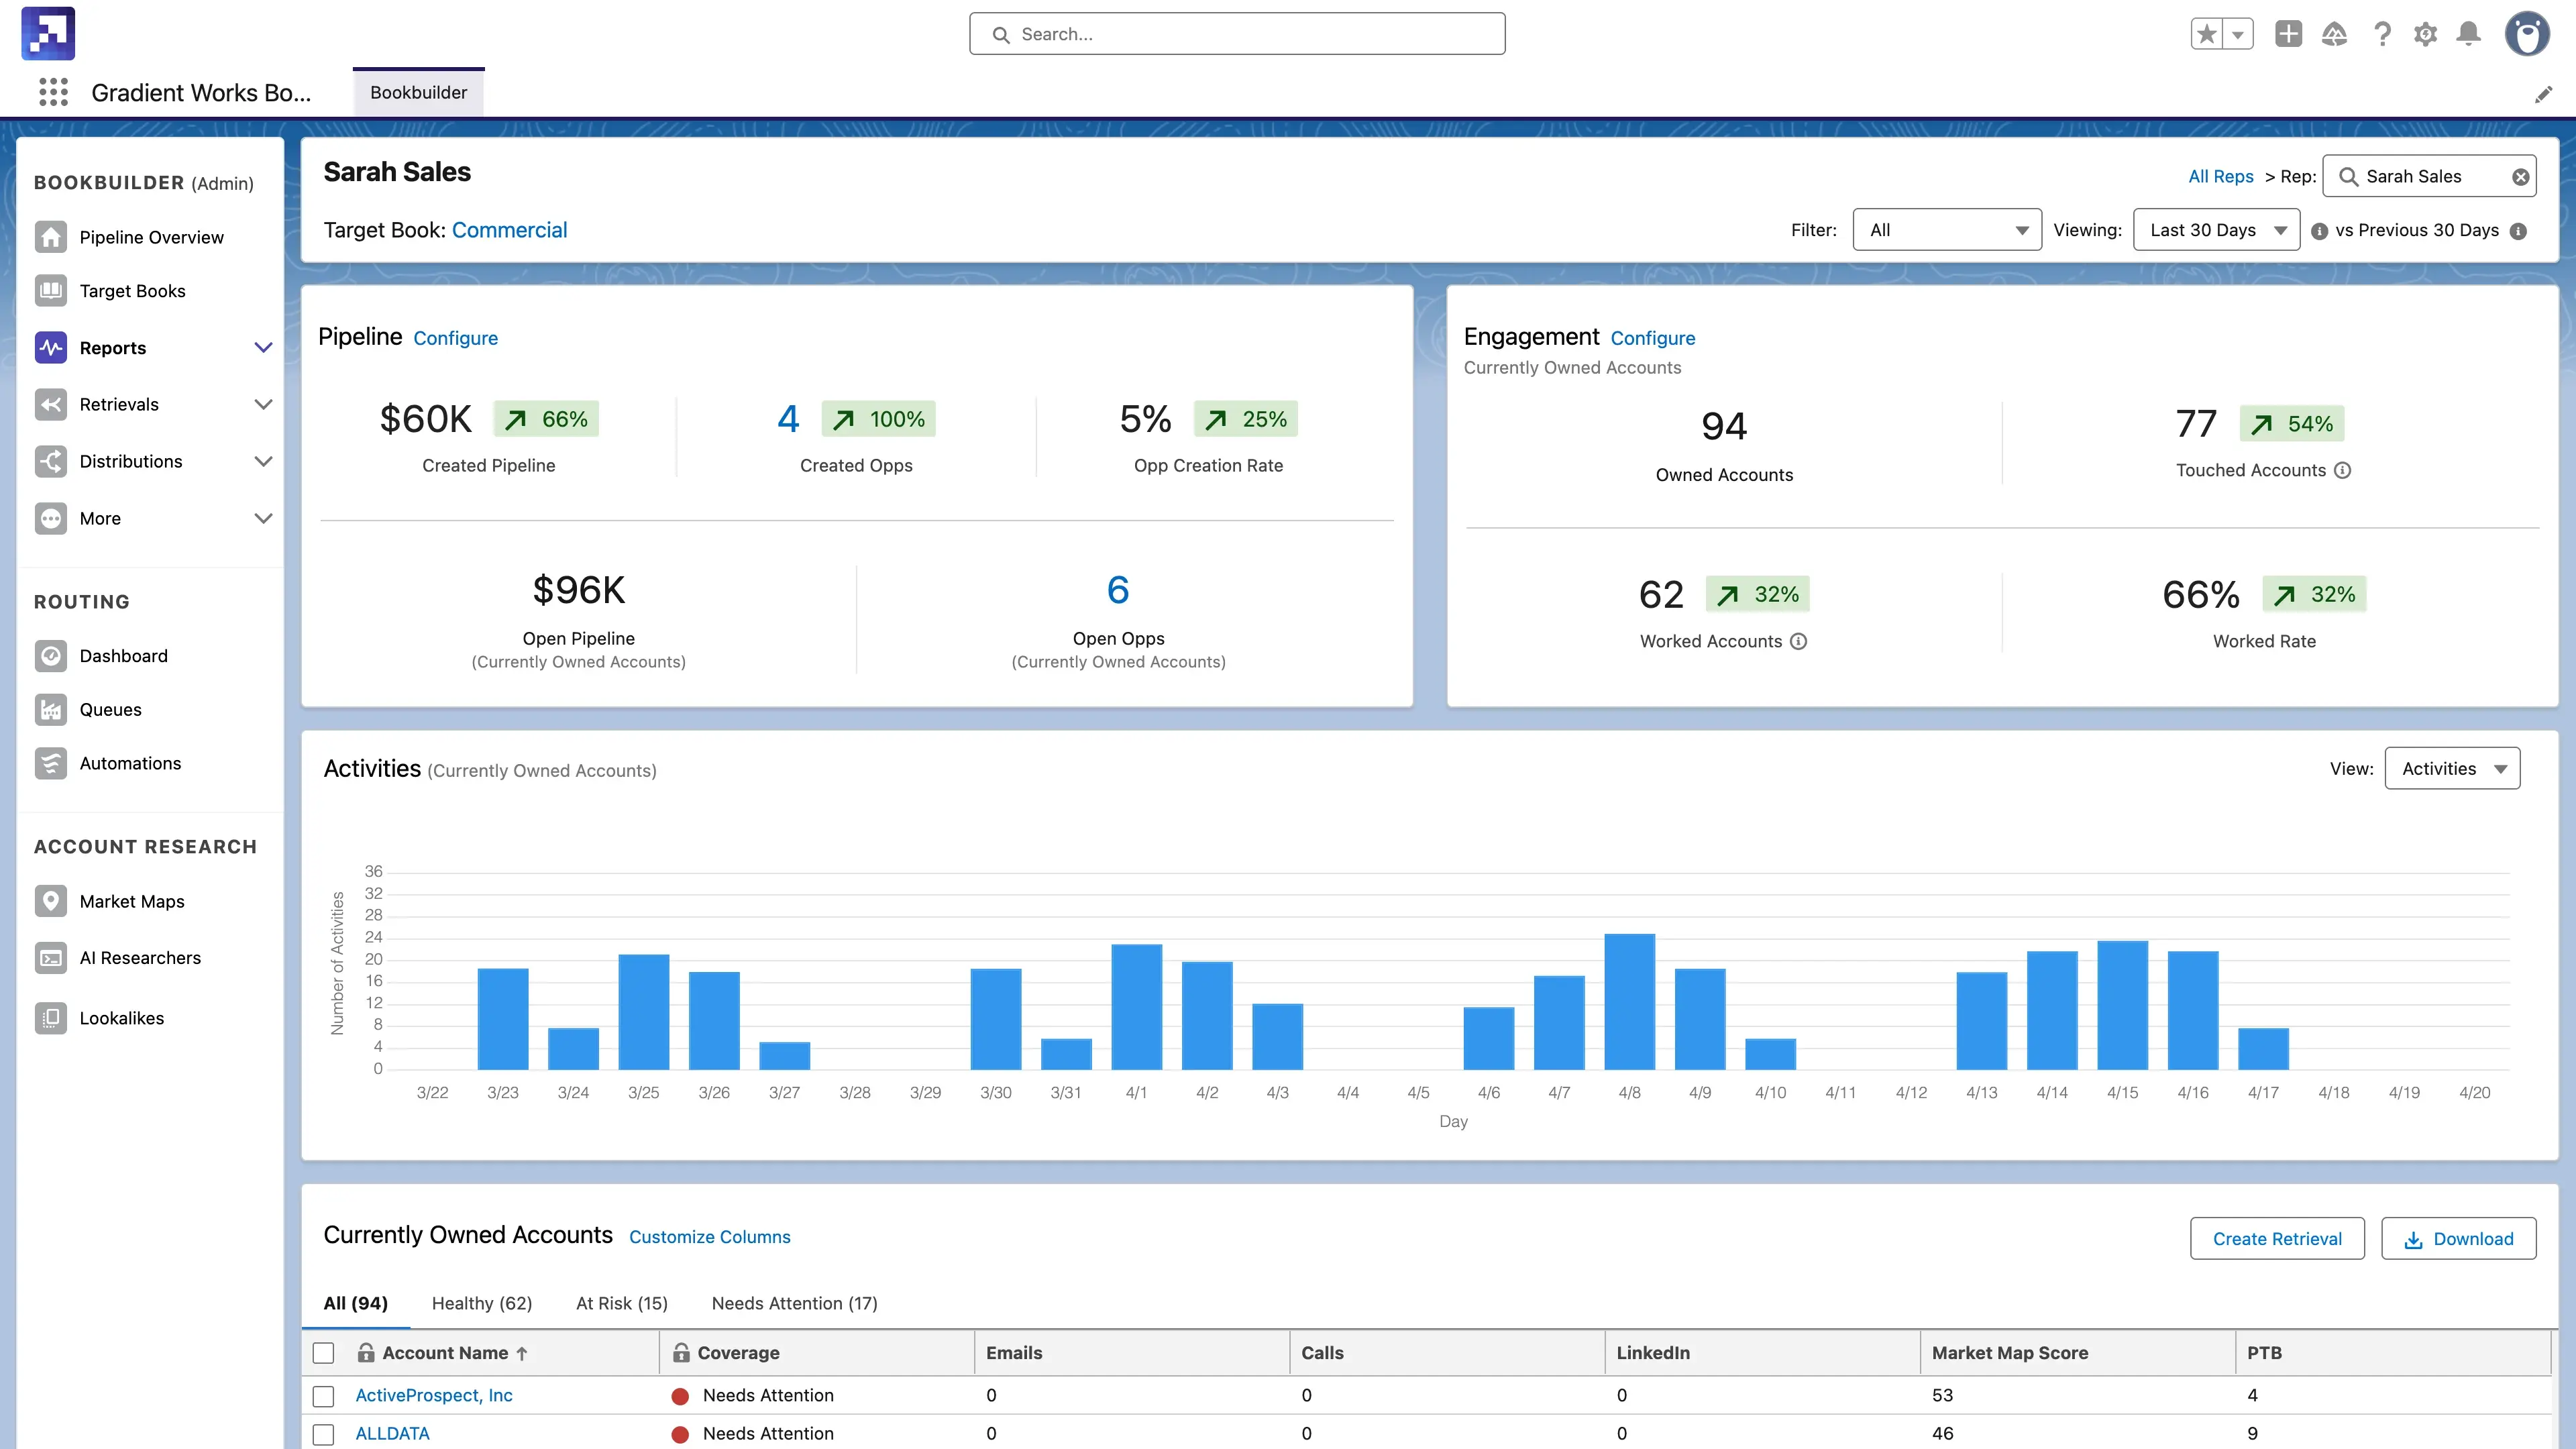
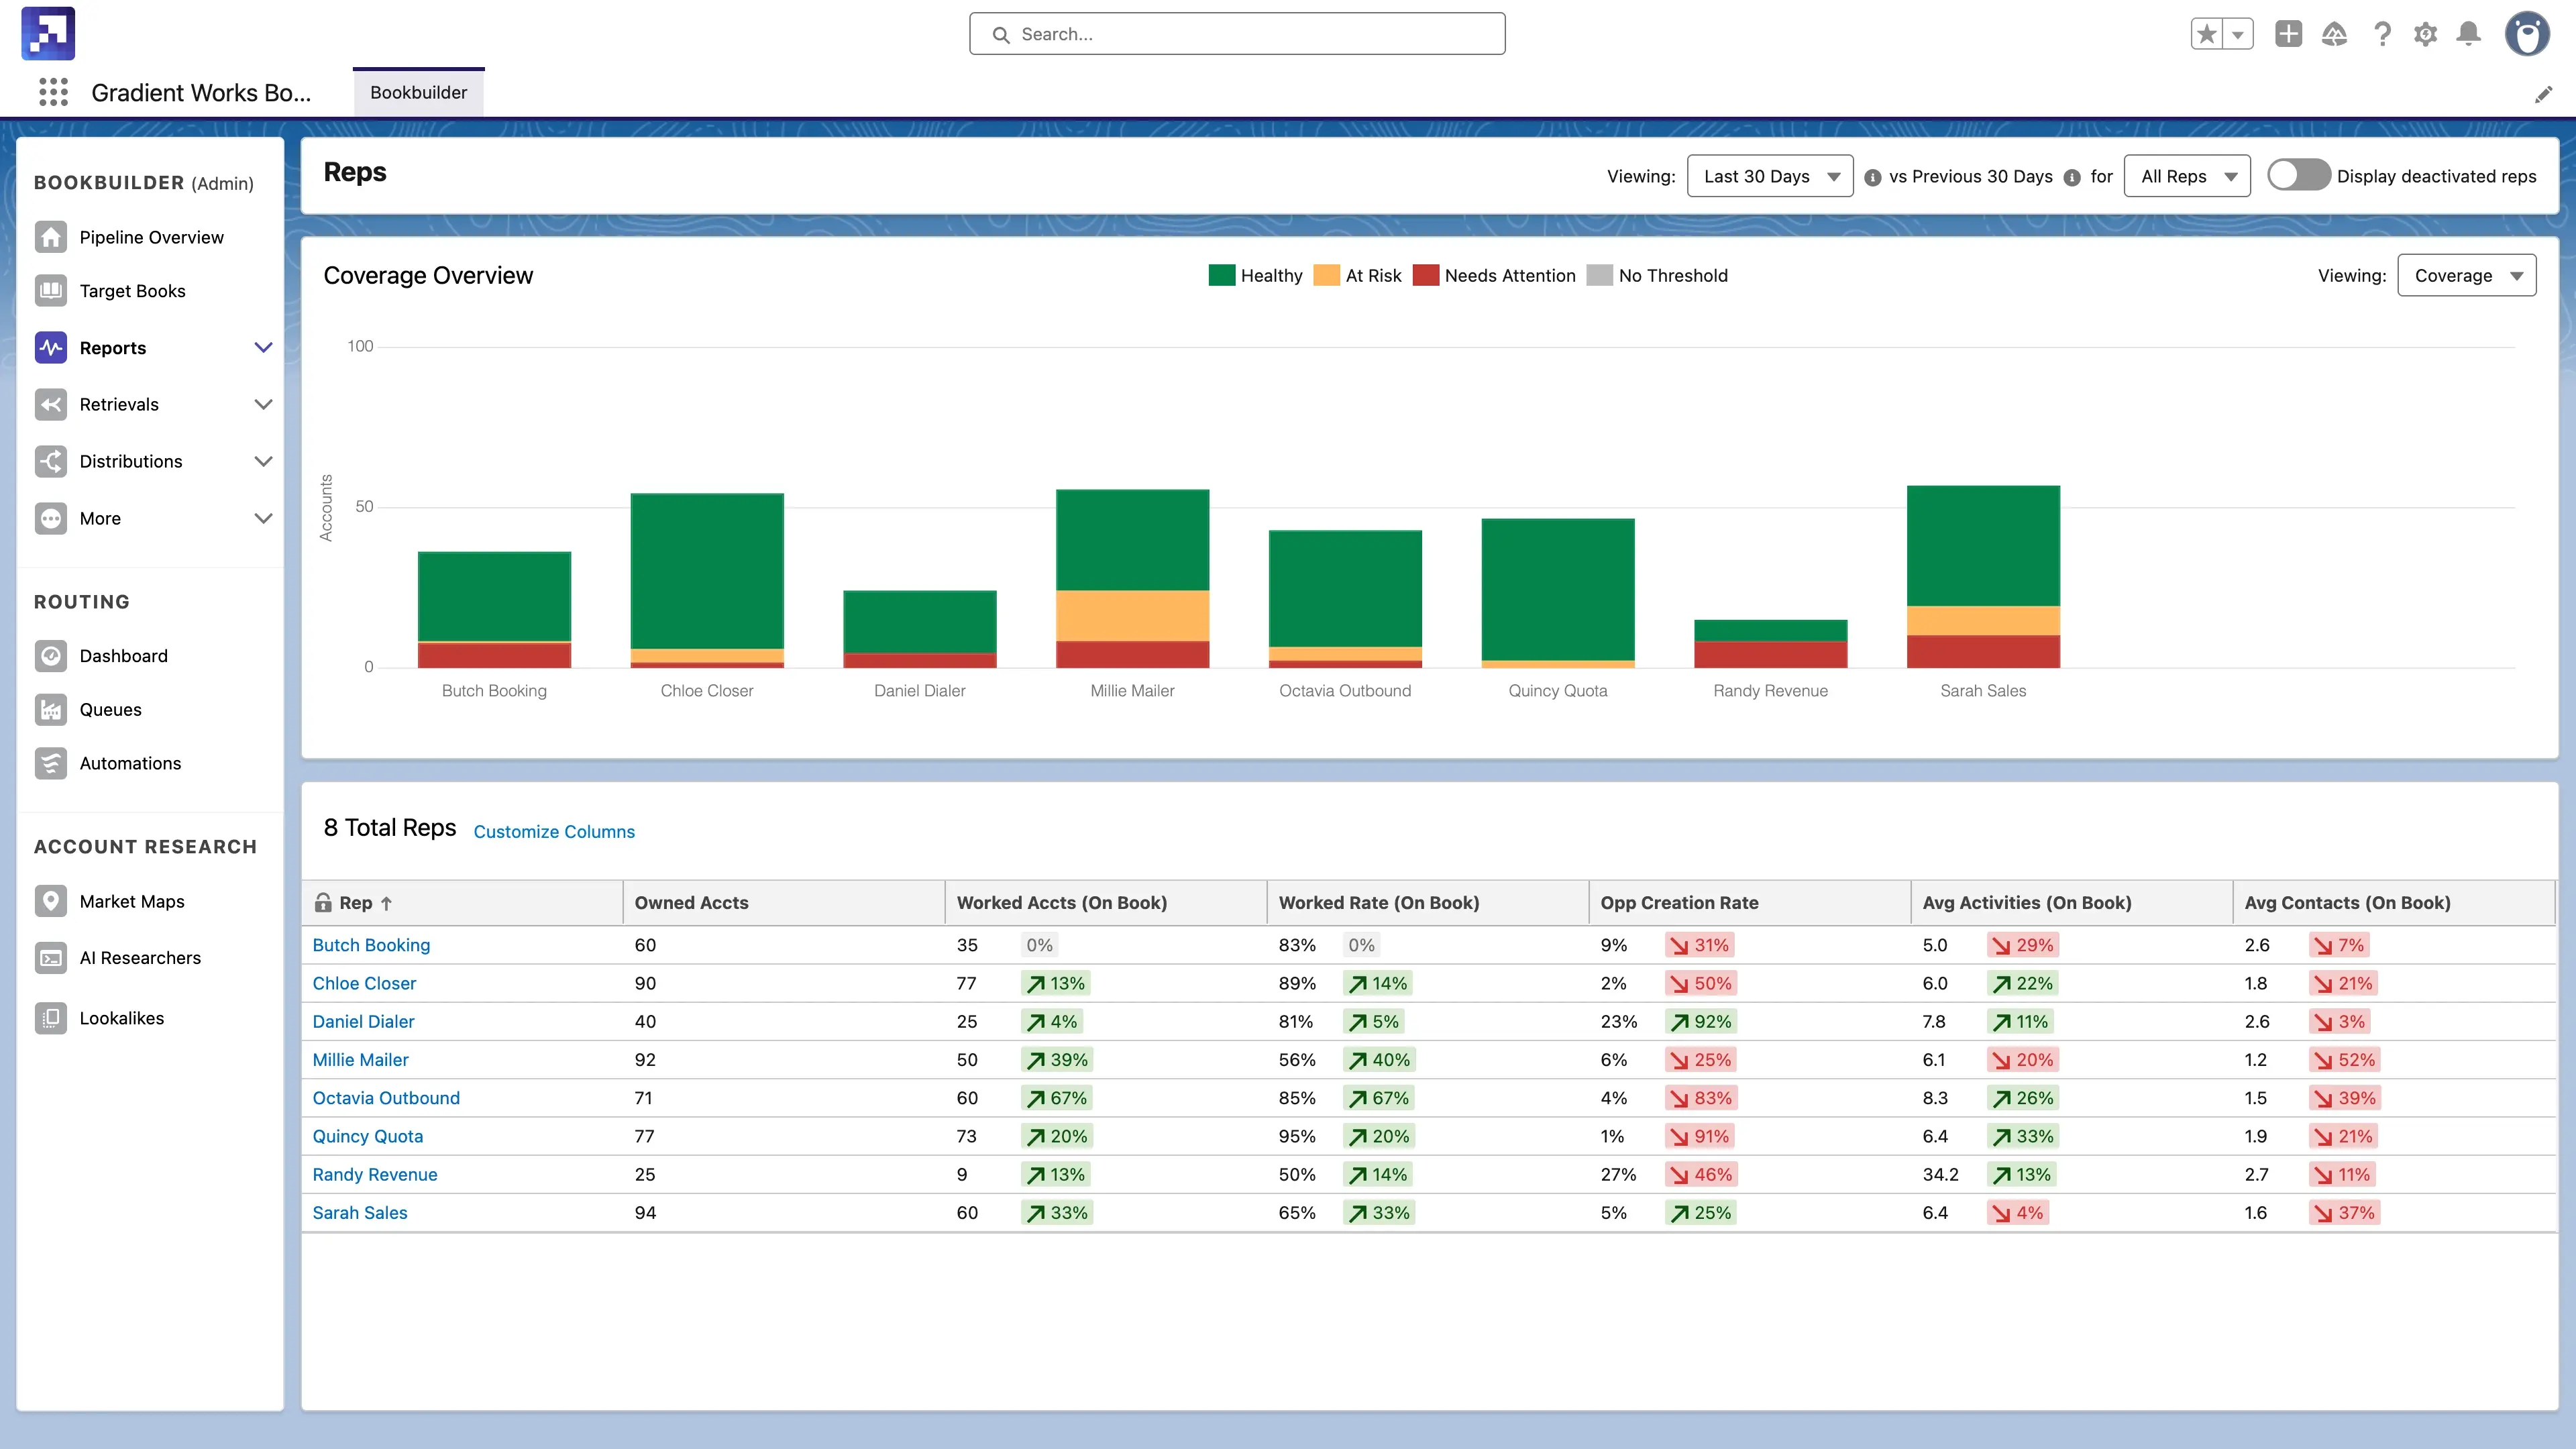
See who's engaging their book and who isn't
Rep reports surface engaged accounts, unengaged accounts, and opp creation rate per rep. Coach on real behavior instead of guesses.
Pipeline Creation
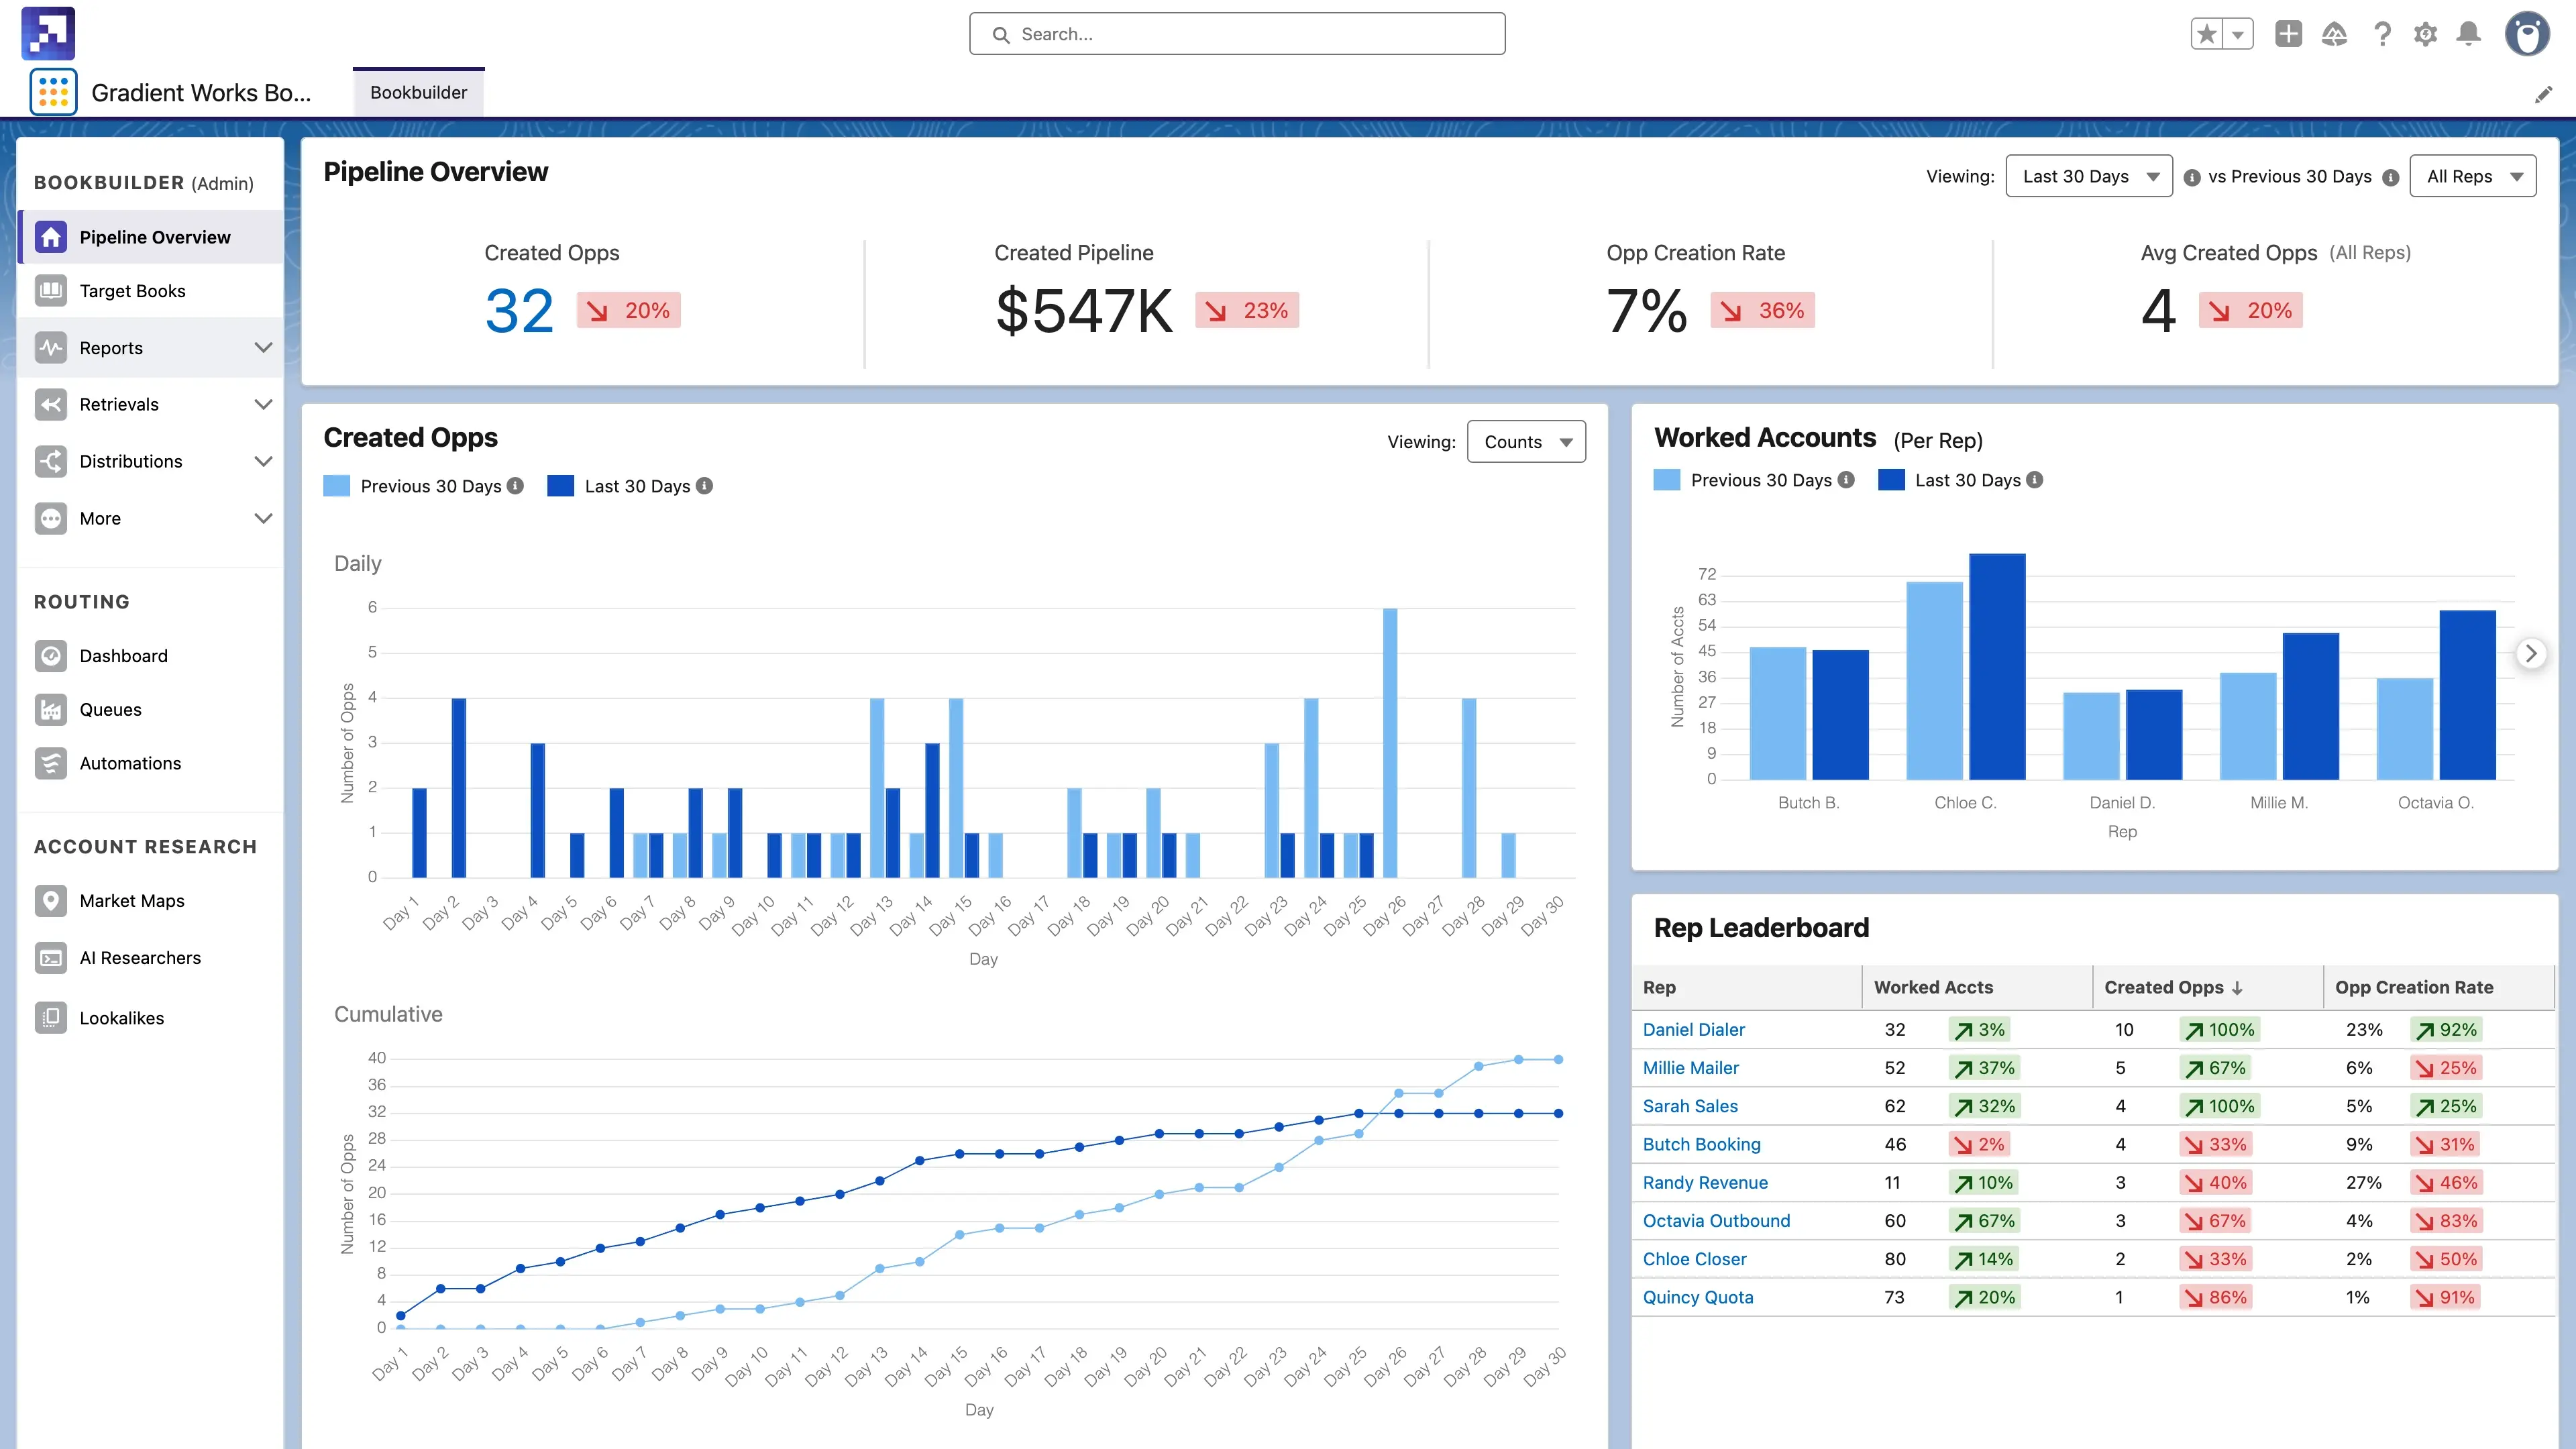
Measure pipeline creation as it happens
Watch opps created, opp creation rate, and open pipeline trend in real time. A coverage report auto-creates for every Target Book, so visibility starts on day one.
Activity Thresholds
Set the bar for what "worked" means
Define activity thresholds by role and segment. The same account doesn't need the same treatment for an SDR and an AE.
Built for the whole revenue team
Analytics tracks account coverage across your team. See which reps are engaging their high-fit accounts, which accounts are going untouched, and how that coverage is translating to pipeline creation.
-
RevOps - Quantify coverage gaps with a number, not a hunch.
-
Sales leaders - See pipeline creation trends weeks before the forecast.
-
Sales managers - Coach reps on the accounts they're actually neglecting.

Activity flows in. Pipeline visibility flows out.
Analytics pulls data from Bookbuilder, Routing, and Salesforce activities to show coverage and pipeline creation as they happen, not a month after the fact.
Pair it with Bookbuilder to coach reps on the exact accounts they're neglecting, or plug it into your existing ops cadence to surface gaps before leadership asks.