

.png)
Q1 was a tough quarter for B2B SaaS, and Q2's not looking much better. But how bad is it, really?
What should your marketing and B2B sales funnel conversion rates be? Especially now when deals seem to be taking longer and converting less.
Besides comparing your current conversion rates and metrics to past performance, you probably want to know how your team stacks up against what other similar companies are seeing in this economy. How is your team doing? You want benchmarks!
We know benchmarks are directional, at best. These numbers will vary depending on how you define each of the marketing funnel conversion stages, and what precisely goes into an MQL, SQL, and opp for your team. There are so many factors that impact a company’s sales cycle, and even the best benchmarks will never be perfect. But if you want a general sense of what B2B SaaS conversion rates maybe should or could possibly look like, here you go.
Basically, take these with a grain of salt.
A note about our methods
Here's where you'll either love or hate that a PhD is writing this article. These data are surprisingly dodgy. There are dozens of references to what seem to be “commonly accepted” figures, without any sign of an original source for these figures. For example, there are multiple references to Salesforce and HubSpot reports that don’t seem to exist. We’ll call those out as we mention them, partially to highlight the reliability issues with some of these numbers.
We tried only to include sources that were clear about their research methods - when the data was collected, from whom, and how. We tried only to use sources that had larger sample sizes.
It’s harder to find current metrics, as well. We know a lot has changed in SaaS marketing and sales funnel conversion rates in the past few quarters, and we can all see that things are slower in our own pipelines. But it will be a while before that shows up consistently in the data.
We’ve identified as many recent figures as possible and noted when a number was first cited (and where) in the list below.
Hopefully, this is a large enough grain of salt. Now with that salt, please enjoy.
Marketing and sales funnel conversion rates
General changes
-
Win rates have decreased to 17-20% (2023, Winning by Design)
-
Number of stakeholders in a deal increased to 10 in 2022 (2023, Ebsta & Pavilion)
-
42% of companies saw a decrease in quota attainment in 2022 (2023, Everstage & RevOps Co-op)
-
63% of companies are facing significant challenges with outbound (2023, Everstage & RevOps Co-op)
-
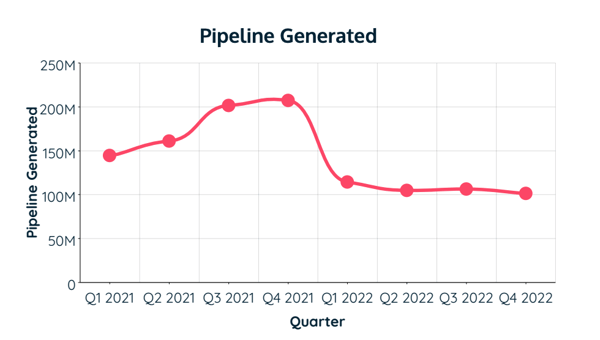
Pipeline generation down 47% in 2022 (2023, Ebsta & Pavilion, see chart below)
Inbound to MQL
-
13-15% is one of those vague industry-accepted standards (pre-Covid, no original source)
-
11-15% (2023, Winning by Design)
-
12-25% (2018, Gartner)
-
33% (2022, RevOps Squared)
-
39% (2021, First Page Sage)
MQL to SQL
-
13% is the vague industry-accepted average MQL to SQL conversion rate (pre-Covid, no original source)
-
12-26% (2018, Gartner)
-
16-20% (2023, Winning by Design)
-
21% (2019, TOPO/Gartner)
-
20% (2022, RevOps Squared)
-
38% (2021, First Page Sage)
SQL to opportunity
-
42% (2021, First Page Sage)
-
59% for SDR-sourced leads (2019, TOPO/Gartner)
Opportunity to close
-
20% is the vague industry-accepted standard (pre-Covid, no original source)
-
6% (2014, Implisit & Salesforce)
-
10-28% (2023, Winning by Design)
-
37% (2021, First Page Sage)
-
22% for SDR-sourced deals (2019, TOPO/Gartner)
Sales cycle length
-
Sales cycles lengthened 32% from 2021 to 2022 (2023, Ebsta & Pavilion)
-
Nearly half of companies have seen increases in sales cycles (2023, Everstage & RevOps Co-op)
-
Startups have seen a 24% increase in sales cycle, with the biggest increases in enterprise deals, which are 36% longer (2023, Tomas Tunguz)